
In the stunning 2016 Presidential election, we accurately predicted 47 out of 50 states plus Washington D.C. days ahead of the results. In 2020, predictions are considerably more complex. In addition to the vast number of early votes cast, thousands of which were cast prior to the first debate, we have observed a number of rare phenomenon, including shifts in personal values, induced by the pandemic, protests and increased polarization.
While the powerful Resonate Ignite Platform leverages thousands of predictive models to discern +14,000 attributes about individuals, it’s not purpose-built for election prediction. But it’s 2020. So we decided to apply our cutting-edge machine-learning and artificial intelligence to one of the most complex challenges: the U.S. Presidential Election.
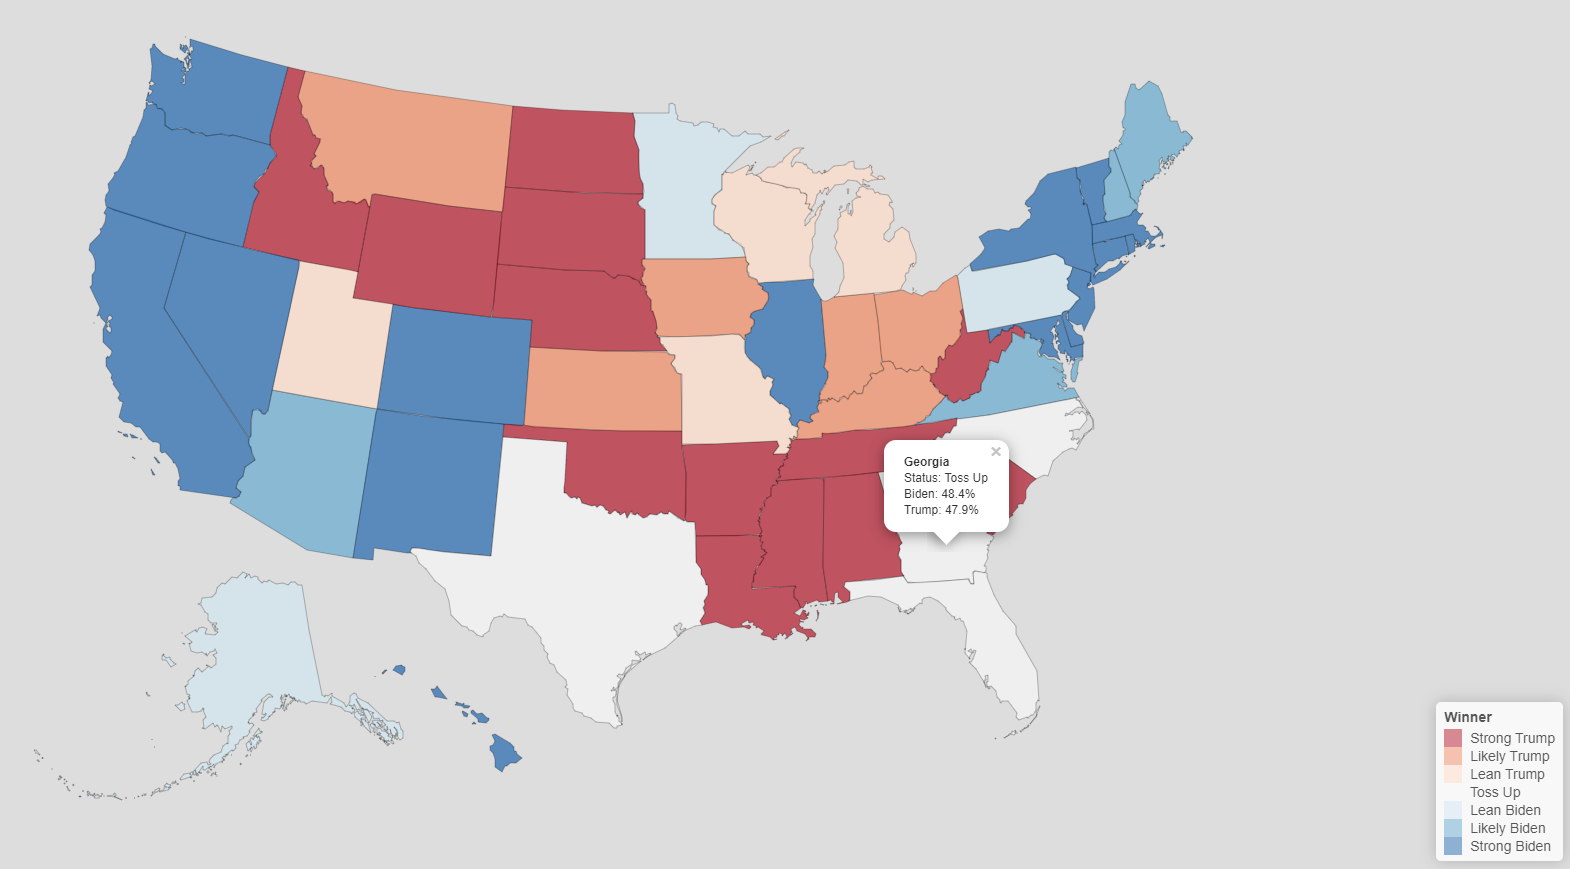
2020 Presidential Election Prediction Leans Biden
Atypical election activities are causing a great deal of uncertainty in an election that could ultimately be decided by less than a few percentage points. The toss-up states of Florida, Georgia, North Carolina and Texas are closer than before. In fact, our models show toss-up states like Florida and Georgia are within the margin of error, with a +/- 2% margin of error.
What makes Resonate’s 2020 Presidential Election prediction different than those from pollsters? The powerful Resonate Ignite Platform leverages thousands of predictive models to discern tens of thousands of attributes with extreme accuracy.
Counter to the current polling, the Resonate Platform is projecting Trump to win Wisconsin and Michigan again. However, swing states such as Florida and Pennsylvania appear to be going blue, by the narrowest of margins, alongside other traditionally red states like Texas and Georgia, each of which could very well be decided by less than .5%.
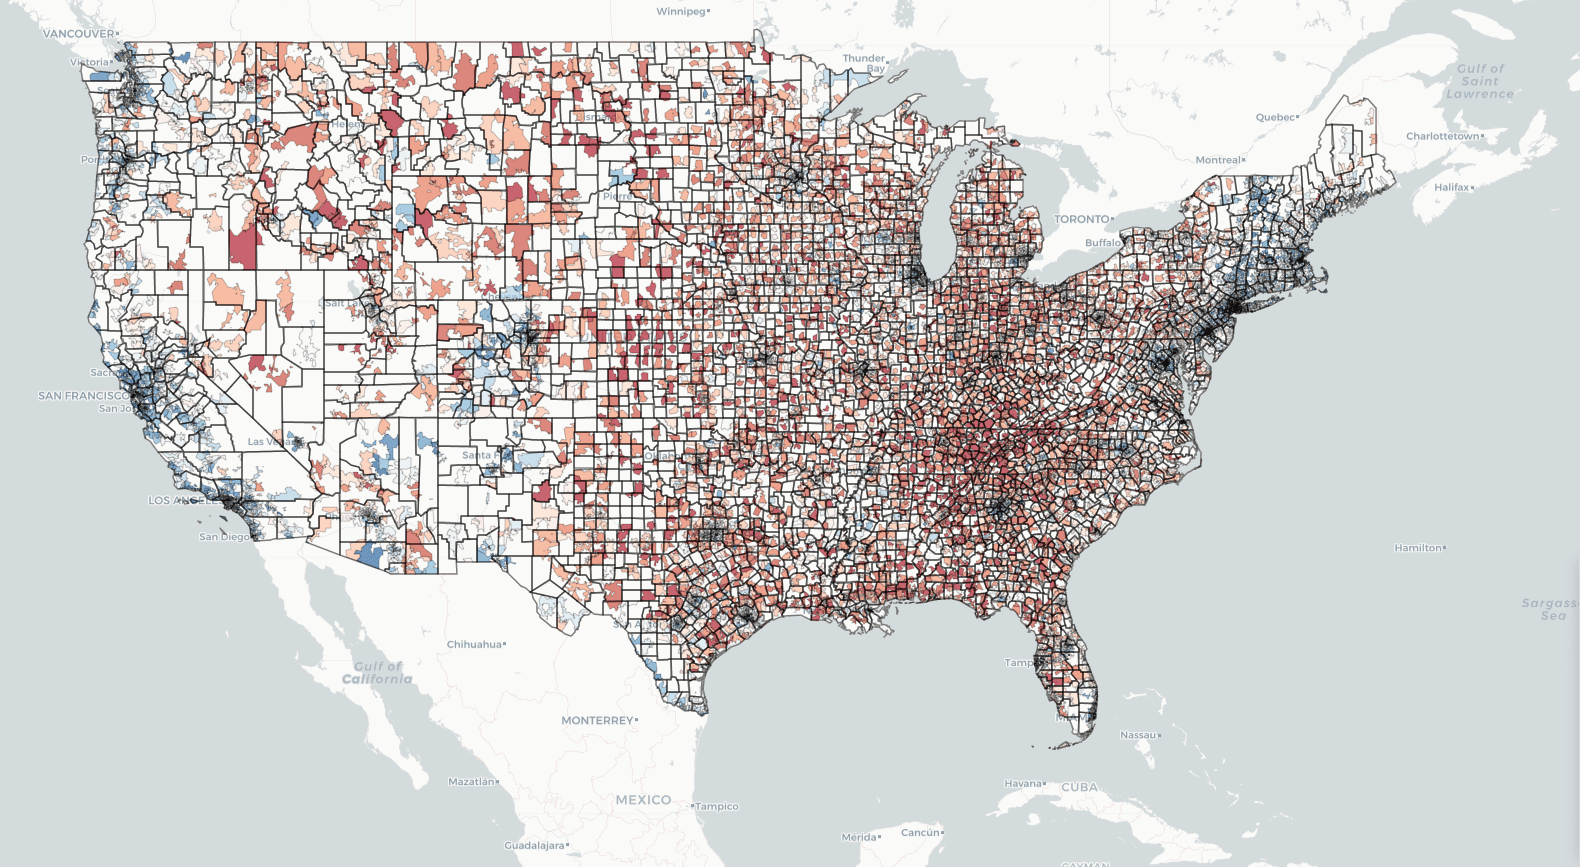
Resonate has an up-close look into not only which way states will swing but how votes are distributed on a DMA, congressional district and zip code level. This information is critical for the Presidential election, as well as local and state-level campaigns, and it allows us a glimpse into the diverse voter blocs distributed throughout battleground states. When Resonate Elements data, such as that illustrated in these election prediction maps, is combined with other first-, second- or third-party data sets, true insights are revealed at an individual level. The ability to understand consumers with comprehensive, multi-dimensional data, at the human level, including their personal values, is vital to engaging today’s voter, consumers and your customers.
Methodology
Resonate uses proprietary data from the Resonate National Consumer Study and multi-petabyte data set of directly observed voter and consumer actions with over 10+ billion new observations per day. This data is then analyzed with the best-in-class machine learning and AI to predict how other U.S. adults would answer key questions such as who they intend to vote for. Using this methodology and an “algorithmic vote” within each state, we correctly predicted 47 states and Washington D.C. in 2016 – missing only Minnesota, Pennsylvania, both of which were decided by less than 45,000 votes, and Florida which was decided by a mere 166,833 out of 9,420,039 votes cast. In our 2020 model, each state is predicted +/- 2% points. Request a demo or learn more.