Online media patterns emerging in Pennsylvania this cycle reinforce the state’s reputation as a fierce election battleground; a battleground Trump barely claimed in 2016 with 0.7% of the vote.
Want to learn more about the digital media bubble phenomena in modern day politics? View the SlideShare – Breaching the Bubble: Establishing an Effective Counter Narrative in an Era of Echo Chambers.
Statewide and local operatives in Pennsylvania would be wise to pay close attention to the patterns emerging in their target areas. Having real-time access to this level of voter behavioral intelligence will best position campaigns to:
- Identify emerging pockets of momentum prime for Get-Out-The-Vote and mobilization efforts.
- Locate and target high-yield counties and districts home to Independents sympathetic to the campaign’s messaging.
- Combat harmful news stories – as they break – by establishing counter narratives online that target and are tailored to sympathetic voters trapped in opposition media bubbles.
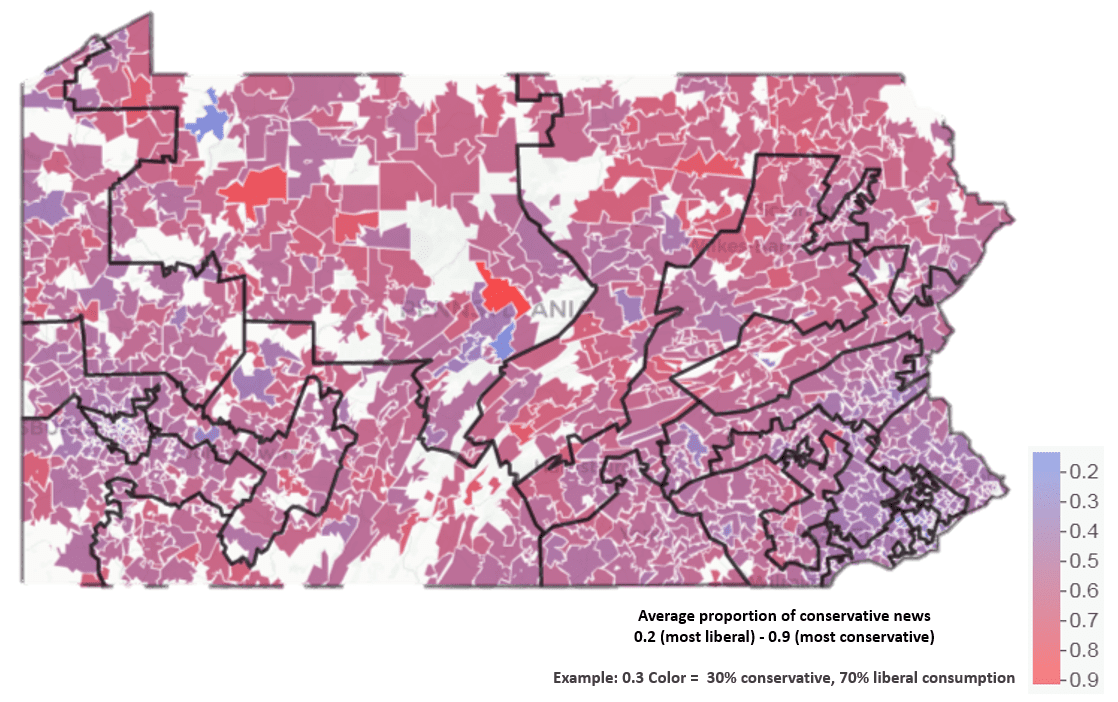
The below map identifies digital media bubbles throughout the state of Pennsylvania. The wave of purple indicates that the majority of Keystone State voters are having election-based conversations that are consistent with an independent narrative. Conservatives nor liberals hold an outright advantage in conservation control.
Resonate’s AI (artificial intelligence) solutions allow campaigns to see clearly into murky political landscapes like Pennsylvania by understanding how digital behavioral patterns are informing voter positioning throughout the course of election cycles.
Media Bubble Methodology
- Machine-learning technology, observing 10B online events daily, monitored all news consumed by individual devices located in Pennsylvania – at zip code scale.
- Automated URL and contextual analysis quantified the ideological slant of every publication along conservative and liberal lines.
- The proportion of bias in media consumption was calculated, at zip code level, by averaging the activity of all devices observed within each zip’s boundaries.
Understanding the Results
- The maps use a color-scale to show the average proportion of conservative news consumed per zip code: 0.2 (most liberal) to 0.9 (most conservative).
- Example: 0.3 color would mean on average, 30% of a device’s behavior is conservative in that zip code (by extension, 70% on average is liberal).
- White space represents areas where census is too low to provide adequate data.
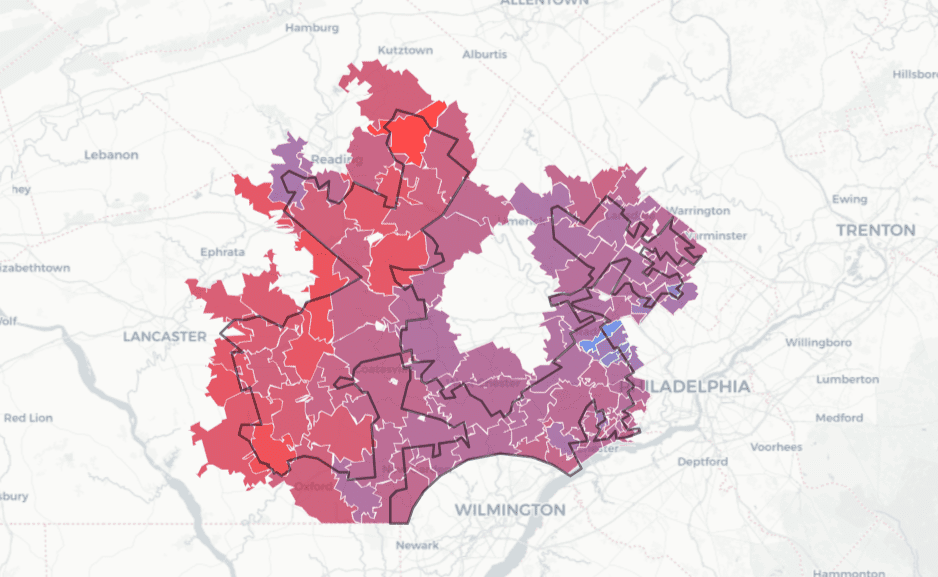
PA-07

The above map documents real-time media bubbles throughout PA-07, a toss-up House race recently redrawn to advantage Republicans. However, the Republican incumbent who dominated the district in years past resigned this year amidst scandal, which changed the status of the PA-07 midterm from “safe” to “toss-up”.
The behavioral patterns we see in PA-07 today support how close things are in the district this year. While the voters in the western part of the district are largely engaging with conservative media, voters in the east have a demand for independent and liberal-based media.
This type of localized behavioral intelligence can serve as a strategic weapon for both sides. In the case of PA-07, Republicans can capitalize on the heavy momentum they have out west towards Lancaster, while Democrats can do the same in the east towards Philadelphia. When it comes to engaging the independent-minded voters who often decide the margins in the toss-ups, both sides should focus on the heart of the district where the minds are open and the conservation is mild.
Stay Tuned for More Resonate AI Behavioral Maps
In the coming weeks, Resonate will be publishing a series of media bubble maps like those seen in Pennsylvania, leveraging AI to measure voter behavior and sentiment in the most competitive states and districts.
Want to learn more about media bubbles? Check out Resonate’s free SlideShare presentation that provides a detailed assessment of the media bubble phenomena in modern day politics: Breaching the Bubble: Establishing an Effective Counter Narrative in an Era of Echo Chambers.