History will show the final two months of the 2016 presidential election changed the course of American politics. An election that lived its final summer promising an inevitable result was staggered by an unprecedented evolution of sensational media scandals. The scandals of the fall would come to define a new way of playing politics in the modern media arena.
Although as it happens in politics, stories die and Americans are on to the next one in a customized 24/7 news cycle where business is validating the views of the viewers. Although one particular 2016 scandal, Hillary Clinton’s use of a private server, continues to breathe in the post-election era; and for good reason.
Given the recent attention to the role Clinton’s email server or James Comey’s bombshell letter played in the election’s outcome, I thought I’d revisit a post-election analysis I conducted in late November 2016. The analysis consisted of measuring the consumption of the fall’s scandalous topics across 2 groups: a decisive Trump constituency in 3 critical swing states and the remainder of the electorate residing in those states. Specifically, we singled out White, Blue Collar Voters in Florida, Michigan and Pennsylvania.
This analysis was a trivial pursuit for me because Resonate maintains a 90-day window of US internet behavior and an “always-on” modeling capability, eliminating the type of errors we saw in traditional polling methods. With our models, I simply identified the topics of interest amongst our targeted electorate and queried our data repository.
For each scandal that displayed significant levels of interest, I identified keywords that allowed me to track consumption of associated media coverage across the internet. This process allowed me to isolate the individual devices (smart phones, tablets, computers) within our three targeted states that were accessing stories related to scandals. Next, I leveraged machine learning models, developed from our massive survey dataset, to label whether or not focal state devices were operated by our target group (White, Blue Collar Voters).
At this point, I was able to determine if the frequency of consumption was proportional to the frequency of the two groups overall (i.e. was the entire electorate randomly reading about each scandal, or was interest focused to specific voting blocs?)
To recap, I only used a petabyte scale dataset of US internet behaviors and textbook best practices data science to illuminate significant findings. So before moving on, toss any partisan biases aside – what you’re about to see are actual numbers assessing the impact of these scandals across a voting group widely recognized as responsible for putting Trump in the White House.
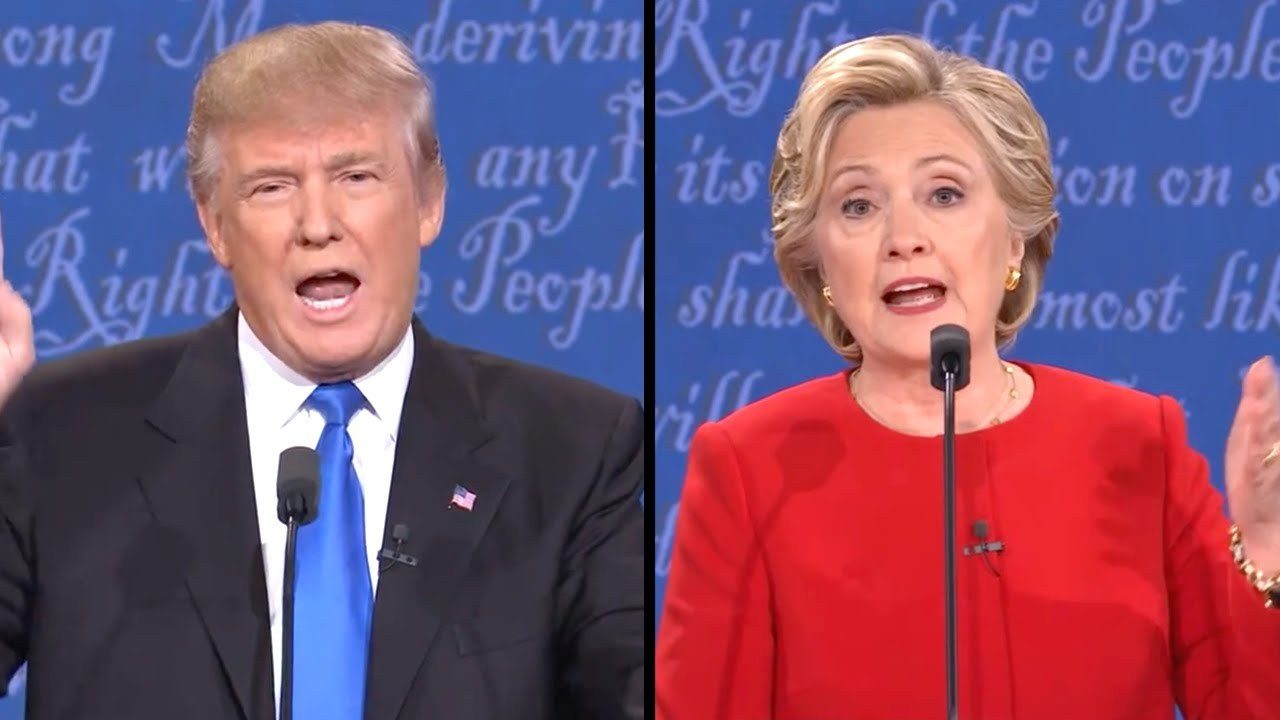
For comparison purposes, I want to focus on two scandals: Hillary Clinton’s e-mail server and Trump’s Access Hollywood tape (the locker room thing).
For each scandal, I’ll show the natural logarithm (threshold) ratio of our target audience reading about these scandals vs the number of the electorate we’d expect to see consuming this news if the odds were pure random.
In the charts below, the points above the dashed red line indicate our target audience was reading about these topics more frequently than random. The points below indicate less interest amongst this audience, which in turn suggests the remainder of the states’ electorate began to demonstrate a heightened interest. Let’s compare the charts and see what we find:
The Server
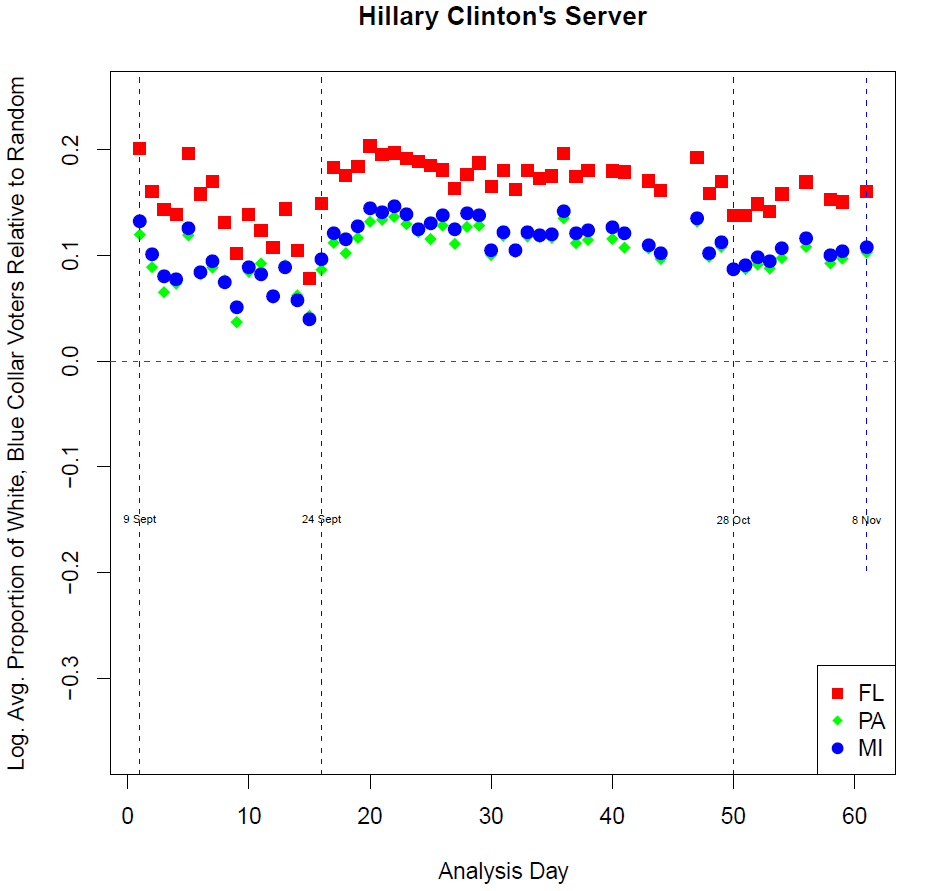
The astonishing thing about the server scandal is just how persistent it was across Trump’s core electorate. Throughout the entirety of the analysis window (September 9 – Election Day) our target audience displays consumption that is not at all consistent with randomness. These critical voters were dead set on not letting this scandal die.
If you direct your attention to October 28th – 11 days before the election and the day Republican Representative Jason Chaffetz publicly leaked Comey’s private letter to the House Oversight Committee, you’ll notice this date precipitates a moderate decline in the stories’ interest amongst our target audience (implying a trivial increase in the remainder of the US electorate).
If you’re thinking this small decrease in interest implies that Comey was solely responsible for mobilizing a decisive Trump electorate just before decision day, direct your attention to Sept 24th. Prior to this date, interest in the server scandal was clearly waning. However, on Sept 23rd the FBI publicly released 200 pages of investigative notes surrounding the email server. As the analysis shows, news of this release picked the server scandal up off the canvas and took it the distance with Trump’s winning voters.
Instead of focusing on the minimal dip in interest prior to the Comey letter, the data says the attention should shift to the undeniable September spike and who exactly was behind releasing the notes on the 24th. If the Democrats are still looking for their man in the lineup, this would be a good place to begin.
Access Hollywood
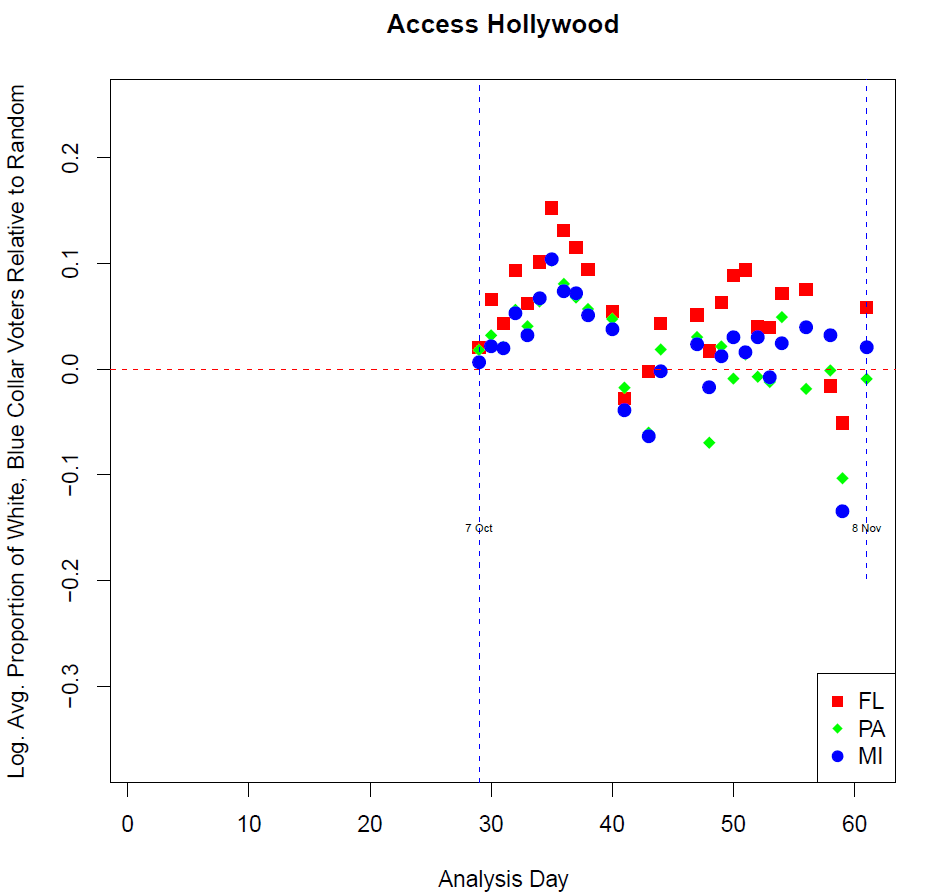
By comparison, our Access Hollywood scandal analysis shows how significant the server scandal was. Remember that our target voter audience was “White, Blue Collar Voters” and did not define individuals by party affiliation or other political attributes, which may have explained the severe difference in interest levels between the stories.
As the analysis supports, the Access Hollywood tape was a non-factor at the ballot box with this important electorate. We see our target audience peak interest for a week and then agree to let the story die.
What does all this mean?
The real issue, from my point of view, is that Hillary Clinton could not exploit or at a minimum overcome unfavorable media coverage.
From here we enter into the speculative, but one must consider that if the Clinton campaign had access to dynamic models that showed just how significant the email server story had become in states like Michigan, Florida, and Pennsylvania, they could have taken steps to stop the bleeding or even change the narrative.
Furthermore, access to voter data that provides deep-level insights into the values and motivations of the voters engaging with damaging narratives would have given the campaign an opportunity to precision target this audience with messaging capable of changing perspectives or at a minimum, introduce another side of the coin.
I have a rather unique opportunity, working as data scientist at a digital consumer and voter intelligence company, to study national phenomena that are otherwise intractable. If you’d like to continue the conversation about what these figures might mean for the future of politics, or if you’re just as fascinated by density dependent phenomena and decentralized networks as I am, I’m all in.
About the author: Dr. Daniel Scantlebury is a Data Scientist at Resonate